Leaving Community
Are you sure you want to leave this community? Leaving the community will revoke any permissions you have been granted in this community.
Why you should tidy up your data
One of the requirements for ODC-TBI is that your data must be in a standard format called tidy format. Why do we ask for this? The goal of the ODC-TBI is to promote data use through implementation of the FAIR data principles, to make data Findable, Accessible, Interoperable and Reusable. The tidy format is an important means by which we make data both interoperable and reusable, because it is a form which maximizes the ability to reuse the data for other purposes. Now you might be saying: Why should I potentially spend a lot of time formatting my data so that others can reuse it? Well, it isn’t just for other people. It also maximizes the ability for you, your lab and your colleagues to reuse it as well.
First, what is tidy format? Tidy format refers to data in a spreadsheet that conforms to the following practices:
Every column is a variable.
Every row is an observation.
Every cell is a single value.
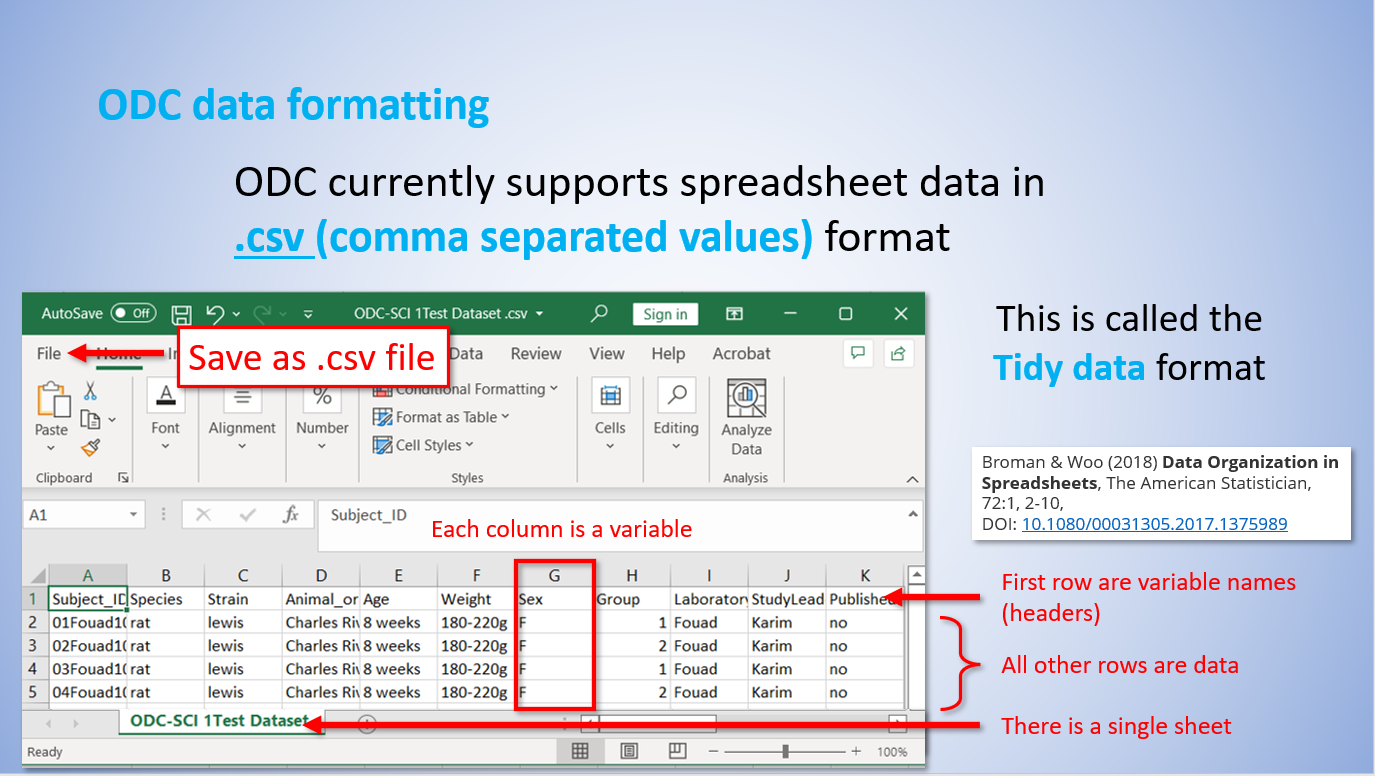
(Fig courtesy of Dr. Abel Espin Torres)
This may seem like an obvious way to organize data, but we find it is not that common. Most data are messy. What are some messy practices?
Column headers are values, not variable names.
Multiple variables are stored in one column.
Variables are stored in both rows and columns.
See a description from the Comprehensive R Archive Network for examples of these practices. And there are many more, e.g., inserting headers in between rows to help group observations, using something like color to indicate a value. As the author of the tidy format likes to quip paraphrasing Tolstoy: “Tidy data are all alike, but every messy dataset is messy in its own way.”
And that is the problem. Messy data, much like a messy room or desk, may work for one individual or application but it is not always easy to reorganize to use it for another. It may work for one tool, but not for another without considerable effort. You may have heard that the biggest time sink when preparing data for analysis is so called data munging or wrangling, that is, transforming it into something that can be used for an application. Tidy format can help reduce that time and effort because it is easy to write code for it in languages such as R and Python. And because all tidy data are tidy in the same way, (i.e., it is a standard), it is taught in data science and computer science classes. That means it is easy to hire and train students and programmers to work with it, regardless of who in the lab produced it.
So while we know it is a burden for some to take outputs of common software like GraphPad Prism and transform it into tidy format, implementing tidy format as part of your data management strategy in the lab ultimately is a good practice to adopt. We hope you will consider it!


About
The ODC-TBI accelerates progress in pre-clinical TBI research through sharing and re-using data generated by the ODC-TBI community, and promoting transparency, rigor and reproducibility in pre-clinical TBI research.
This repository is under review for potential modification in compliance with Administration directives
Contact Us
Adam R. Ferguson, Ph.D.
Brain and Spinal Injury Center (BASIC)
Department of Neurological Surgery
University of California, San Francisco (UCSF)
Email: adam.ferguson@ucsf.edu